Power at 5% THD: 15W
Noise at 46dB (typical) of gain: -60dB from peak signal
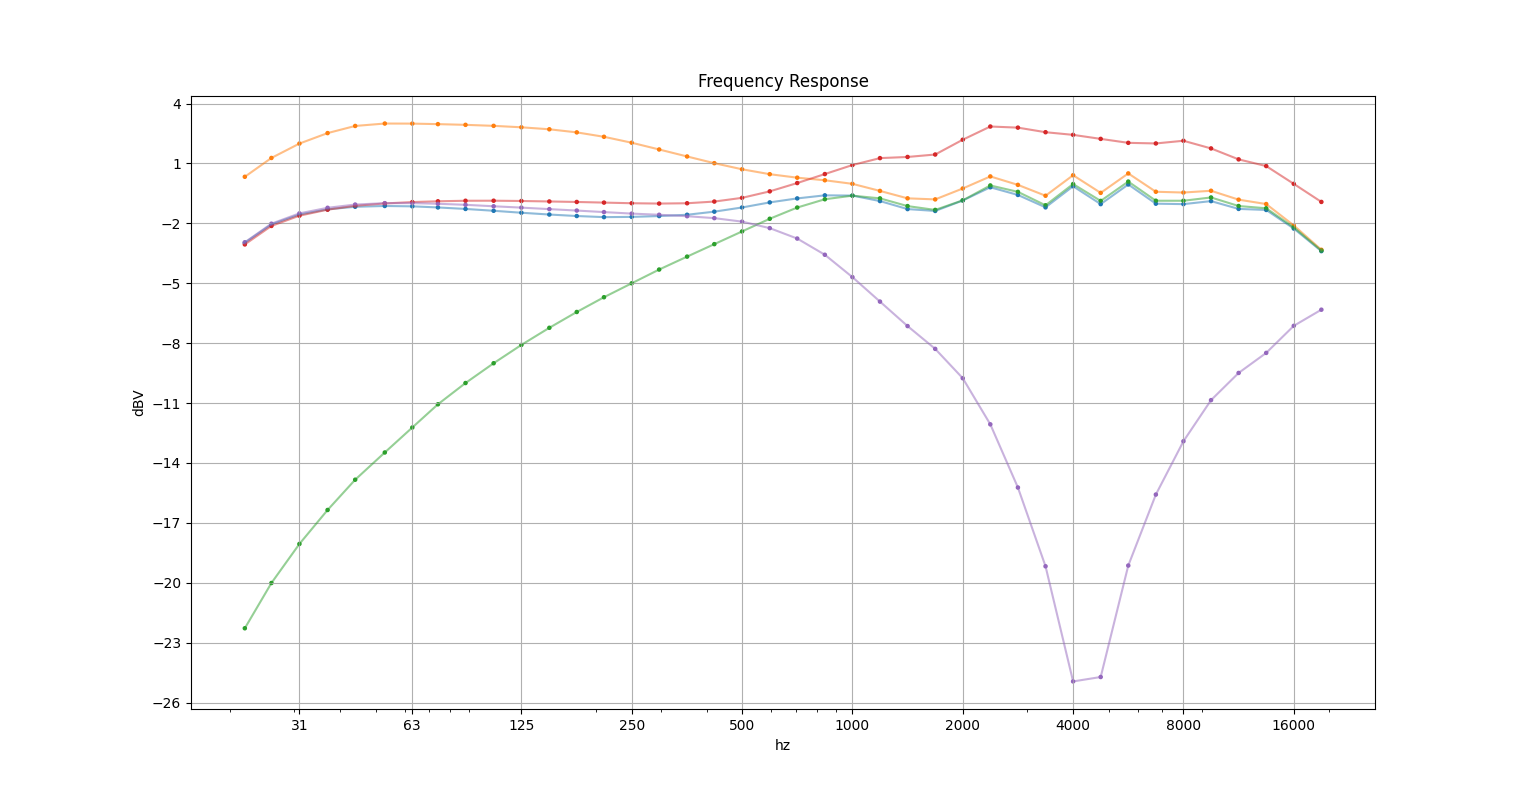
Frequency response chart (the different lines correspond with the bass and treble controls maximized or minimized):

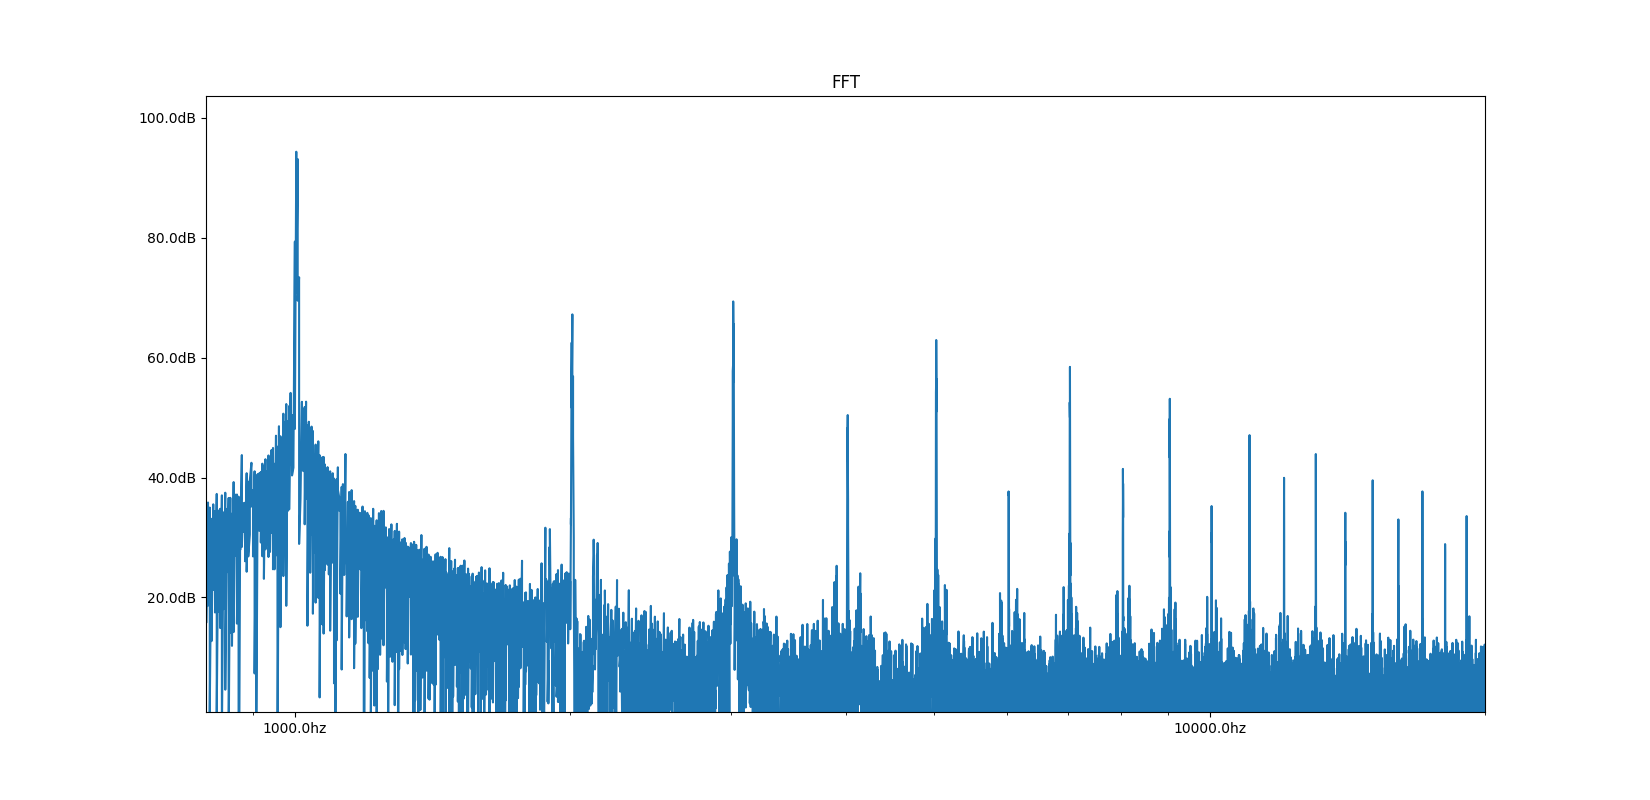
Harmonic content of 1000hz sine wave near max power:

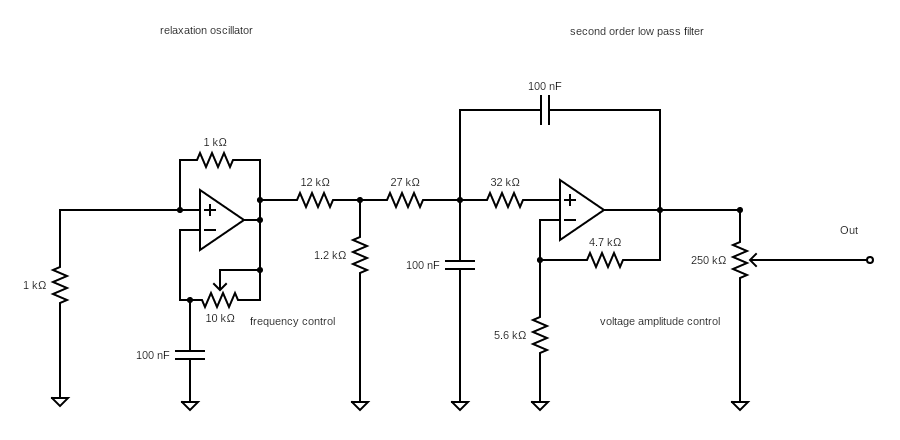
All measurements are taken at the secondary of the output transformer. I used a 8 ohm resistive load instead of a speaker driver. To quantify the power output I built a sine wave generator and chose 1000hz as my test frequency. You can see a schematic below. I set the gain to where I was getting about 5% total harmonic distortion before recording the output. 15W is typical of a pair of cathode biased 6V6 power tubes. Supposedly you can eke a few more watts out of them if you use fixed bias, but that wasn't an option with my power transformer. I used these instructions for measuring THD.
I used a SDS 1202X-E oscilloscope. I wrote some software tools to analyze the data and tell me RMS power and THD (actually THD + noise, but noise was negligible compared to the harmonic distortion). You can read more about those here.
For the frequency response, I first tried applying white noise to the input of the amplifier and using the oscilloscope's onboard FFT to analyze the results but I found it was too noisy. I generated a wav file that consists 4 frequencies per octave between 20 and 20,000hz centered on 1000hz. I built a box with an 8 ohm resistive load (tube amplifiers should not be operated without an appropriate load) and a 10dB pad in parallel. I put my sweep into a DAW. I fed the output of the DAW into the input of the amplifier and fed the attenuated output of the amplifier back into the daw. I wrote some tools to analyze the results. You can read more about that here.
Read more about the amp here. The raw data can be found here.
